01: UN Votes
Getting started
You should open this document in RStudio. To do so:
- Either open your local RStudio program or navigate to <maize.mathcs.carleton.edu> in your browser and log in.
- Go to file –> New file –> Quarto document … –> “Create empty document”. This should open a new .qmd file in your Rstudio session. Delete everything in this file so that you have a totally blank document.
- Next, we need to copy this template into your new quarto file.
- come back to this page and click the “code” button at the top of the page.
- Click the “copy” symbol in the upper right corner of the popup file
- Navigate back to your empty .qmd file and “paste” the text there
- You should now be able to see this document in your own session, and you can run code and edit it as you need to! Make sure to save it in your Stat220 “activities” folder.
Introduction
How do various countries vote in the United Nations General Assembly, how have their voting patterns evolved throughout time, and how similarly or differently do they view certain issues? Answering these questions (at a high level) is the focus of this analysis.
Packages
We will use the tidyverse, lubridate, and scales packages for data wrangling and visualization, and the DT package for interactive display of tabular output, and the unvotes package for the data.
Data
The data we’re using originally come from the unvotes package. In the chunk below we modify the data by joining the various data frames provided in the package to help you get started with the analysis.
unvotes <- un_votes %>%
  inner_join(un_roll_calls, by = "rcid") %>%
  inner_join(un_roll_call_issues, by = "rcid")
UN voting patterns
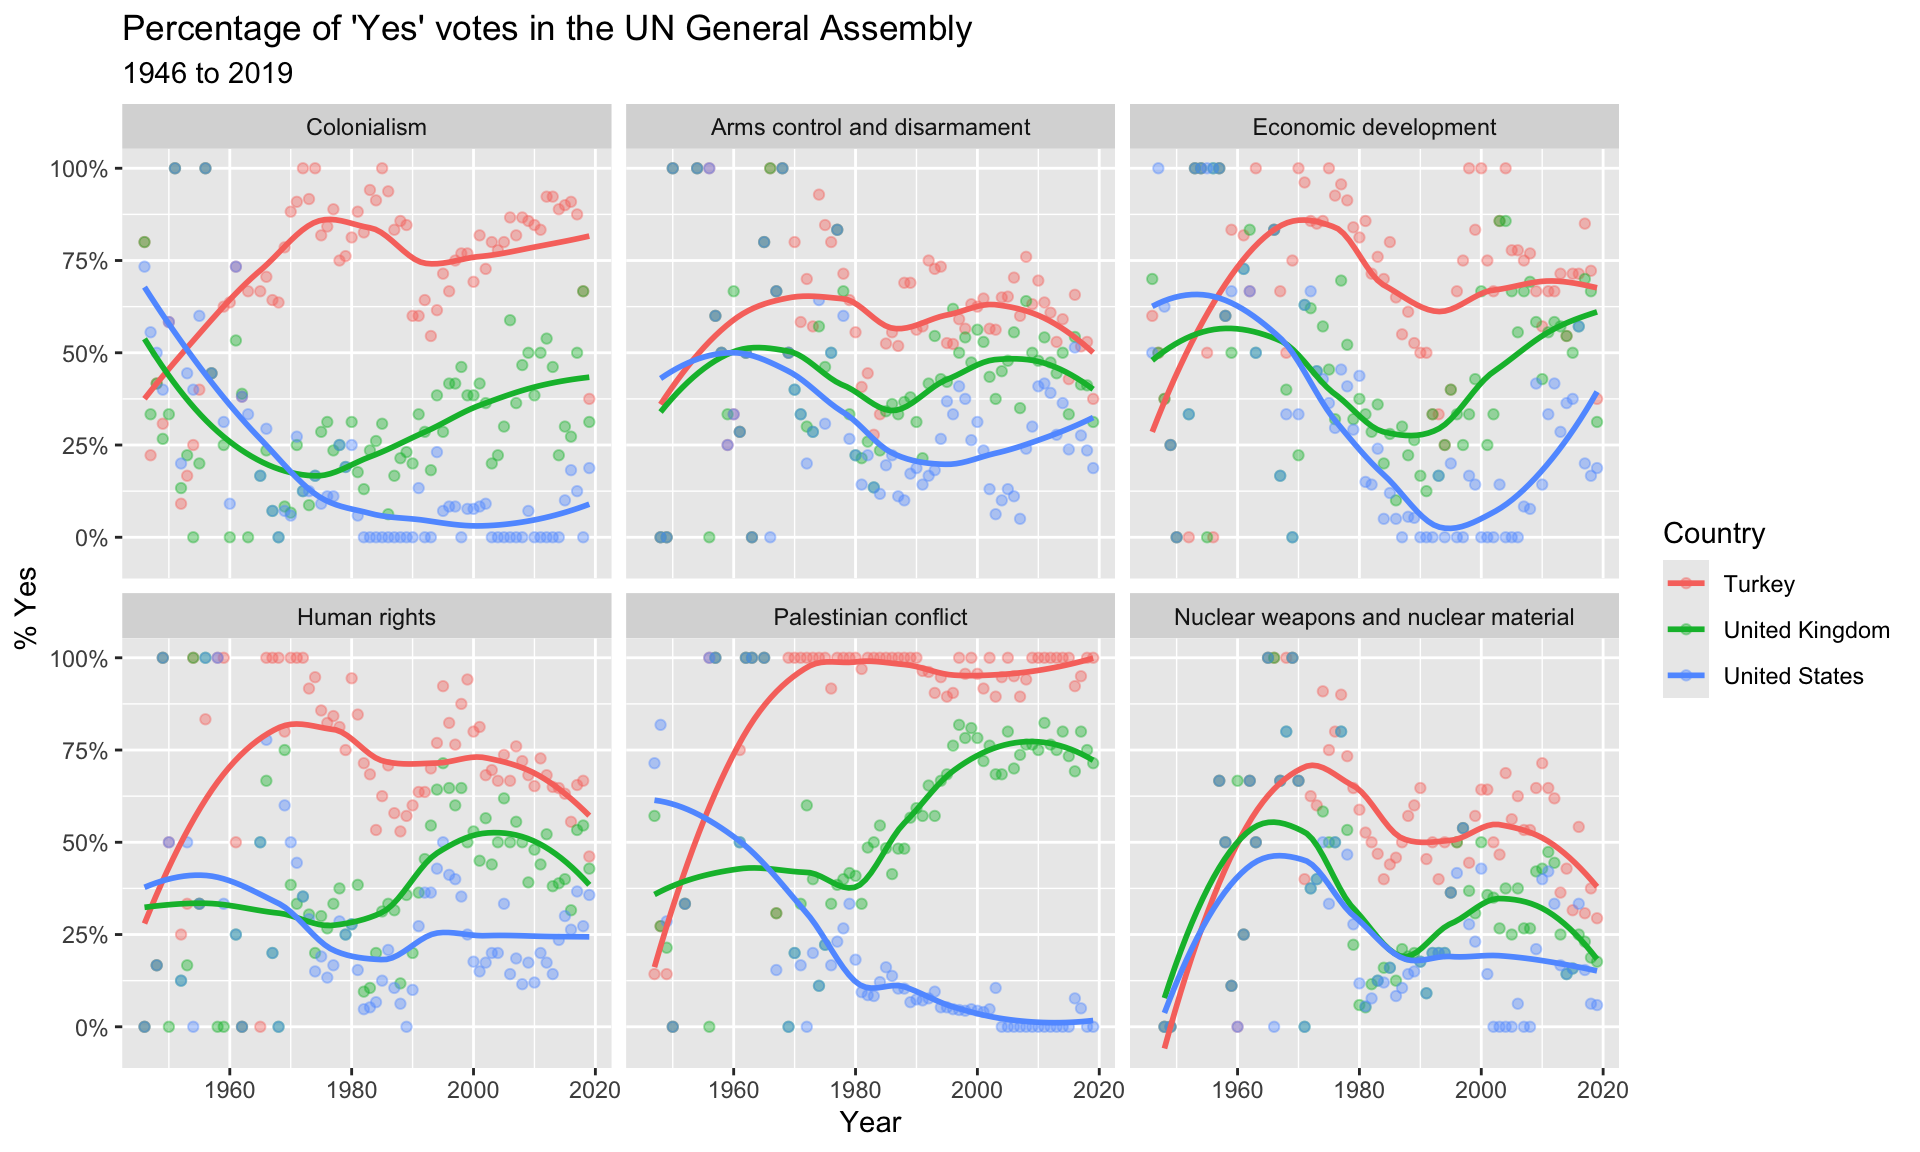
Let’s create a data visualisation that displays how the voting record of the UK & NI changed over time on a variety of issues, and compares it to two other countries: US and Turkey.
We can easily change which countries are being plotted by changing which countries the code above filters for. Note that the country name should be spelled and capitalized exactly the same way as it appears in the data. See the Appendix for a list of the countries in the data.
unvotes %>%
  filter(country %in% c("United Kingdom", "United States", "Turkey")) %>%
  mutate(year = year(date)) %>%
  group_by(country, year, issue) %>%
  summarize(percent_yes = mean(vote == "yes")) %>%
  ggplot(mapping = aes(x = year, y = percent_yes, color = country)) +
  geom_point(alpha = 0.4) +
  geom_smooth(method = "loess", se = FALSE) +
  facet_wrap(~issue) +
  scale_y_continuous(labels = percent) +
  labs(
    title = "Percentage of 'Yes' votes in the UN General Assembly",
    subtitle = "1946 to 2019",
    y = "% Yes",
    x = "Year",
    color = "Country"
  )
References
- David Robinson (2017). unvotes: United Nations General Assembly Voting Data. R package version 0.2.0.
- Erik Voeten “Data and Analyses of Voting in the UN General Assembly” Routledge Handbook of International Organization, edited by Bob Reinalda (published May 27, 2013).
- Much of the analysis has been modeled on the examples presented in the unvotes package vignette.
Appendix
Below is a list of countries in the data set: