Rows: 300
Columns: 11
$ year           <int> 2023, 2023, 2023, 2023, 2023, 2023, 2023, 2023, 2023, 2…
$ month          <int> 10, 7, 3, 12, 7, 6, 8, 12, 2, 7, 8, 1, 1, 3, 1, 2, 2, 5…
$ day            <int> 8, 28, 6, 21, 21, 4, 22, 13, 28, 18, 21, 11, 21, 26, 11…
$ carrier        <chr> "9E", "YX", "AA", "UA", "DL", "B6", "9E", "9E", "YX", "…
$ origin         <chr> "LGA", "EWR", "JFK", "EWR", "LGA", "JFK", "LGA", "LGA",…
$ dest           <chr> "JAX", "IND", "LAX", "RDU", "ATL", "RDU", "PWM", "CHS",…
$ sched_dep_time <int> 1525, 1059, 725, 1815, 1259, 837, 2130, 1149, 1759, 132…
$ dep_delay      <dbl> 16, 22, -9, -1, 7, -7, -7, -8, -5, NA, -7, 164, 3, 26, …
$ air_time       <dbl> 132, 109, 376, 67, 107, 70, 50, 103, 120, NA, 52, 149, …
$ lat            <dbl> 30.49410, 39.71730, 33.94250, 35.87760, 33.63670, 35.87…
$ lon <dbl> -81.6879, -86.2944, -118.4080, -78.7875, -84.4281, -78.…Lab Quiz 01 Info
Our first lab quiz is scheduled for Friday of Week 3. The first second half of class will cover new content, and the second first half of class you will complete the in-person portion of the lab quiz.
Guidelines
This is a closed note, closed internet resources, closed other people lab quiz. I want to see what’s in your brain! You may use the cheat sheets provided by me, but otherwise you may not use any resources.
The lab quizzes are not written to be tricky or very difficult. If you’ve been completing the in-class activities and the homework, and putting the time and effort in to understand them, you should do well on the lab quizzes.
Format
The reason I give lab quizzes is because your life will be easier if you know how to do basic tasks in R “on the fly”. I also want to see what you know and not just what you can do with access to your resources. However, I also know this is not how data science works in the real world, and so there are two portions to the lab quiz.
- The required in-class portion
- Pencil-and-paper questions
- Cheat sheets provided by me but no other resources
- Designed to assess what you know “on the fly” without access to resources
- An optional R-based revision
- .qmd format similar to homework
- Allowed to use materials from class (slides, activities, notes, homework, etc.) but no out-of-class resources (google, textbooks, ChatGPT or other LLMs, StackOverflow, etc.)
- Designed to assess your coding skills and whether you can figure things out with access to class resources and R help pages
Your score on the quiz will be the average of the two scores, unless you do not submit the revision, in which case your score will only be in your in-class score. If you earn 100% on the in-class portion, your overall score will be 100% and I will not grade your revision.
Skills
R Basics
- Given a vector, list, or data frame, extract an element of interest.
- Know how to use each extractor (
x$__,x[__],x[[__]]) and what they return - Construct logical vectors to use as an index to subset a vector or data frame
- Construct integer vectors to use as an index to subset a vector or data frame
- Know how to use each extractor (
- Given a vector, list, or data frame, obtain a quick summary such as the length, dimension, or type of each element
Data Visualization
- Identify the appropriate layer to add to a static graphic in order to display specific information
- You should know the
geom(and associated aesthetics) for the following charts: bar/column chart, histograms, boxplots, density plots, violin plots, scatterplots, time series line plots, map, chloropleth map
- You should know the
- Given a graph and a dataset structure, fill in ggplot2 code to replicate the graphic:
- base layers
- axis labels, titles, captions
-
scale_xfunctions for aesthetics -
facet_wrap()andfacet_grid()
- Given a question of interest and data set, decide on an appropriate graphic to address/answer the question
- You should know when the graphs mentioned above are appropriate
- Given a graphic, describe the strengths and weaknesses of it from a design perspective
- Core principles:
- Accessibility considerations: color, alt text, direct labeling, etc.
Data Wrangling (covered in Week 3)
- Know how the following verbs act on a data set:
filter,slice,select- Syntax for using
- Describe what the output would look like
- Given a data set and goal, identify and utilize the appropriate verb to create the data set of interest
- Use {dplyr} verbs AND the logical vector approach to subset a data frame
Grading
For the in-class portion, each question is worth 1 point, graded as “successful” (almost entirely correct), “not successful” (missing a key component), or “half credit” (mostly correct).
For the out-of-class revision, each question is worth 1 point, graded as “successful” (correct), “not successful” (missing a key component), or “half credit” (mostly correct). Since you will be able to run the code, you will only receive full credit for fully correct solutions.
Revision
The in-class portion will be a pencil-and-paper quiz. After class, I will make everyone a repository on github with a .qmd version of the quiz. (The questions will remain essentially the same). The revision is totally optional. You will work on the repository just like homework and submit via gradescope if you wish to turn it in.
- The in-class portion is worth 10 points
- The revision is worth 10 points
- If you don’t submit the revision on gradescope, your quiz will be out of 10 points and if you do submit the revision your quiz will be out of 20 points.
The revision is due before class starts on Monday. You may use the cheat sheets, materials from our class (slides, activities, notes, your homework, etc.), and the built-in help pages within RStudio. You may not use textbooks, LLMs, search engines, stack overflow, etc. to complete the revision. If your submission contains code that did not appear in our course materials, you must include an explanation for where it came from (e.g. in what context you learned that code). Otherwise, you will not receive credit for that problem and may be reported to the Academic Standing Committee.
Practice Questions
Data
Tip
The quiz will use one dataset, and I will give you some information about it at the beginning of the quiz. All of the questions will use the same data, so if the answer to one question helps you with another, that’s just fine!
The nycflights23 package contains information about all flights that departed from NYC (e.g. EWR, JFK and LGA) in 2023. The main data is in the flights data frame.
For this lab quiz, we’re going to work with a random sample of 300 flights (called flights_sampl)
Questions
Given a vector, list, or data frame, extract an element of interest.
Write R code to do the following tasks:
Store the
dep_delaycolumn in a vector calleddelay_minutesExtract rows of
flightswheredep_delayis more than 15 minutes
Given a vector, list, or data frame, obtain a quick summary such as the length, dimension, or type of each element
Carefully and clearly describe the result produced by the following commands:
length(flights_sampl)dim(flights_sampl)
Identify the appropriate layer to add to a static graphic in order to display specific information
Consider the ggplot code below.
ggplot(data = flights_sampl, aes(x = air_time, y = dep_delay)) +
geom_point() - Sketch a possible graph that this code would create
Note: I know that you do not know what the trends, etc. will look like, so you should focus on making sure that all of the aesthetics are correctly mapped and all of the layers are there
- If I wanted to color the points by month, how would I edit the code above?
Given a graph and a dataset structure, provide ggplot2 code to replicate the graphic
The map below displays the locations of airports with flights arriving from NYC. A few things to note:
- The state borders are
black - The color within the borders is
lightblue - The map uses two datasets.
- The
statesdataset was generated withmap_data("state"). It has the following columns:longlatgrouporderregion
- The second dataset is
flights_sampl
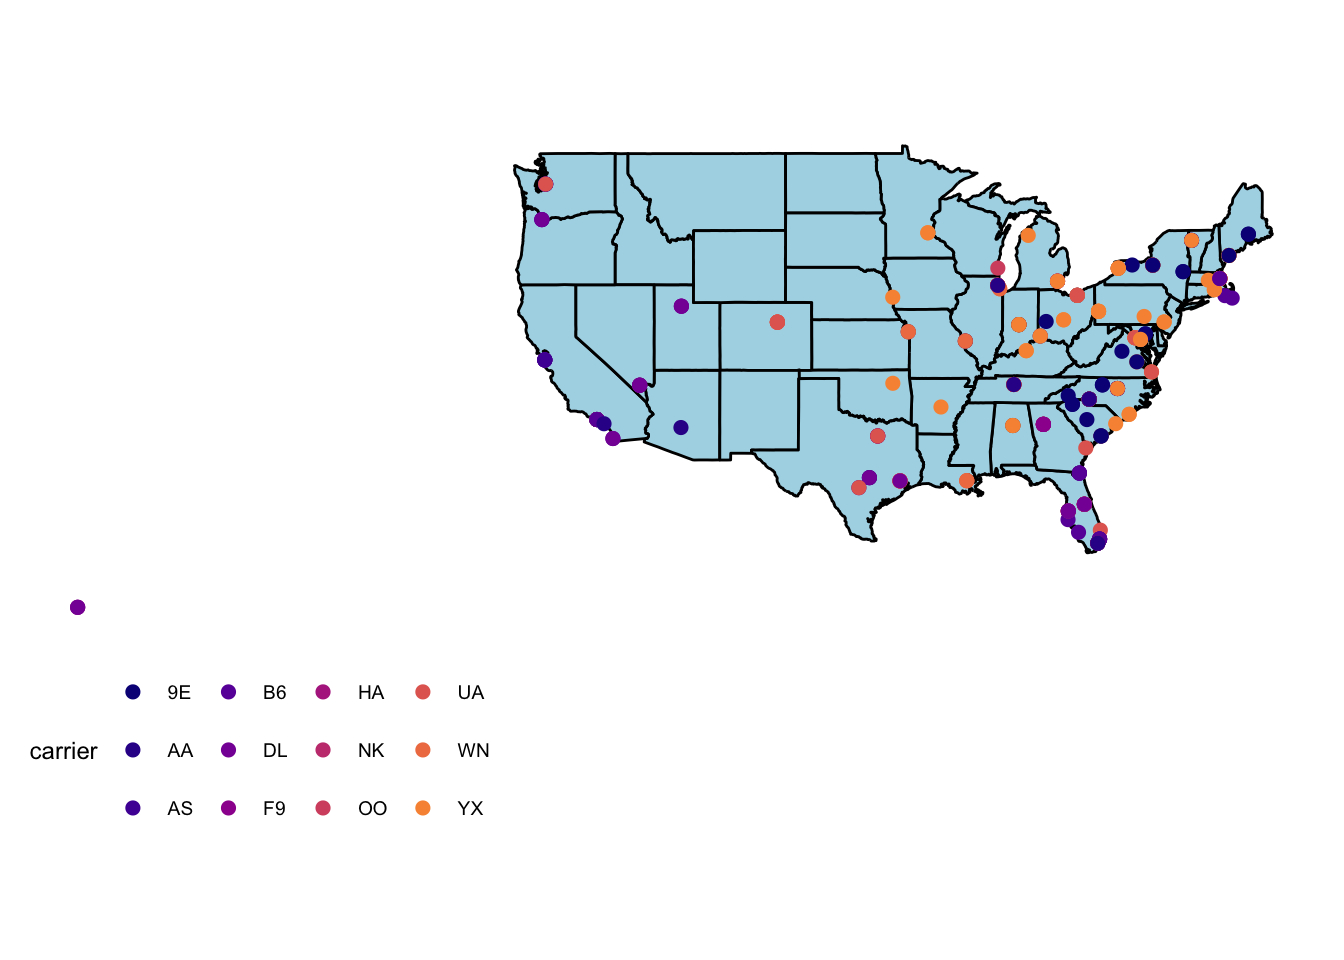
Fill in the missing R code that is required to create this map:
states <- map_data("state")

ggplot() +
  geom_polygon(data = ___,
               aes(___),
               ___) +
  geom_point(data = ___,
             aes(___),
             ___) +
  coord_map() +
  theme_map() +
  theme(legend.position = "bottom") +
  scale_color_viridis_d(end = .75, option = "plasma")
Given a question of interest and data set, decide on an appropriate graphic to address/answer the question
Clearly describe one graph that you could make to answer the following questions:
- Do flights in winter months have longer delays than summer months?
- Is there a relationship between flight length and delay amount?
- What carriers are most common at each of the three
originairports?
Given a graphic, describe the strengths and weaknesses of it from a design perspective
Consider the ggplot graphic below:
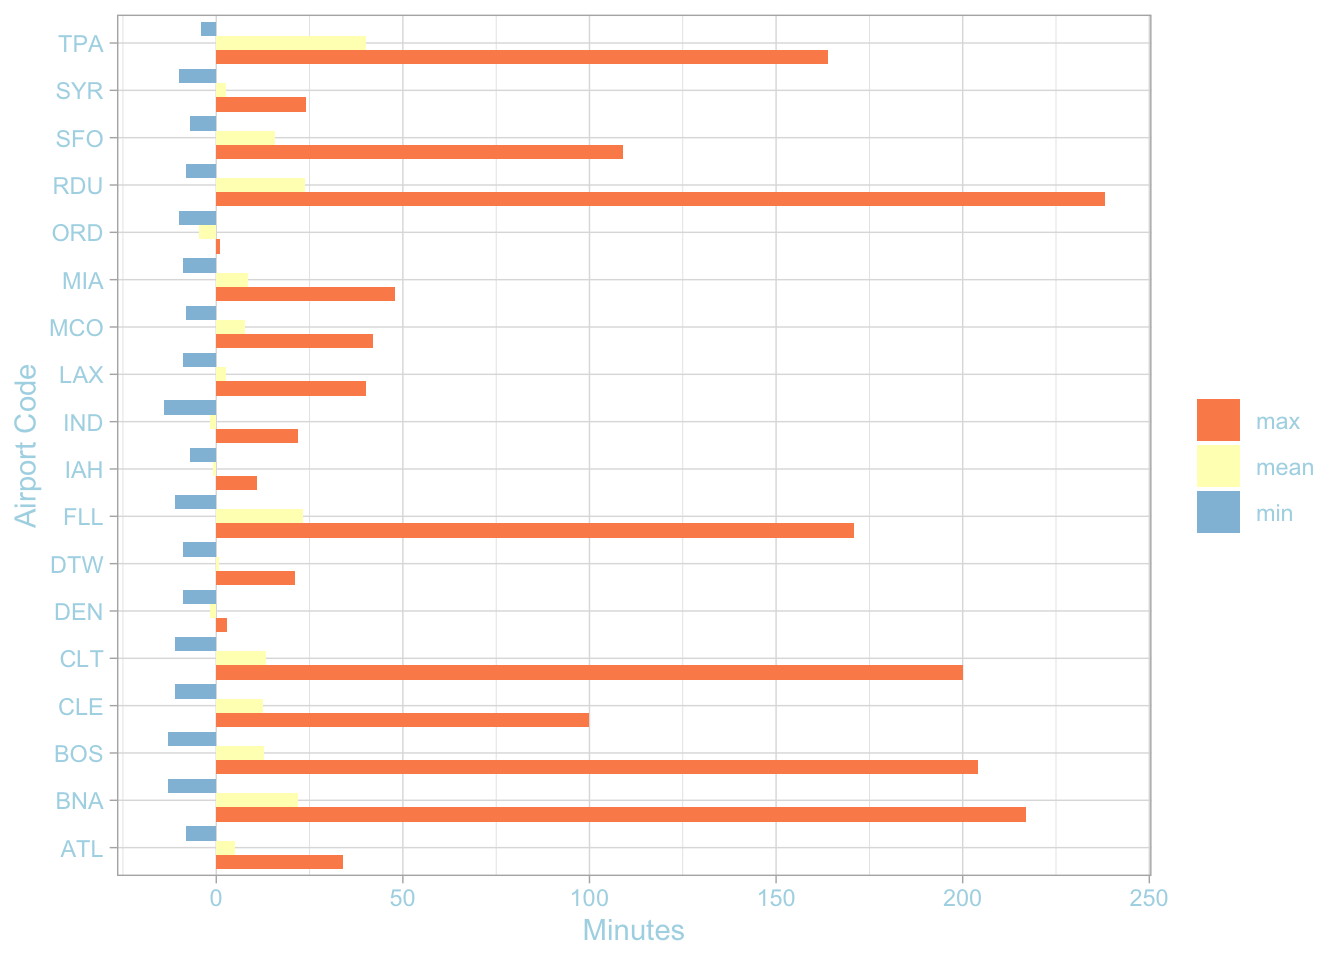
- Summarize what you think the “main point” of this graph is in 1 sentence
- Give one improvement this graph could make in the aesthetic or geometry layer to make the “main point” more understandable
- Give one improvement this graph could make in the theme layer to make it more readable or accessible
Know how the following verbs act on a data set: filter, slice, select
Describe or sketch out what the following R code would produce:
Given a data set and goal, identify and utilize the appropriate verb to create the data set of interest
The small dataset below was generated from flights_sampl. What dplyr verbs were used?
# A tibble: 2 × 4
  month dest  origin air_time
  <int> <chr> <chr>     <dbl>
1     4 MSP   LGA         140
2     6 MSP   LGA         149