# Source: TidyTuesday 9/6/2022
# https://github.com/rfordatascience/tidytuesday/tree/main/data/2022/2022-09-06

sets <- readr::read_csv('https://raw.githubusercontent.com/rfordatascience/tidytuesday/main/data/2022/2022-09-06/sets.csv.gz')02: Lego Report
Note: Use this file as starter code. Your goal is to create a knitted report file that matches the file linked on the schedule
Tip
If you need a refresher for how to access the quarto file from this document, see Activity01
nrow(sets)[1] 19798ncol(sets)[1] 6mean(sets$num_parts)[1] 161.0577sd(sets$num_parts)[1] 402.6161library(tidyverse)
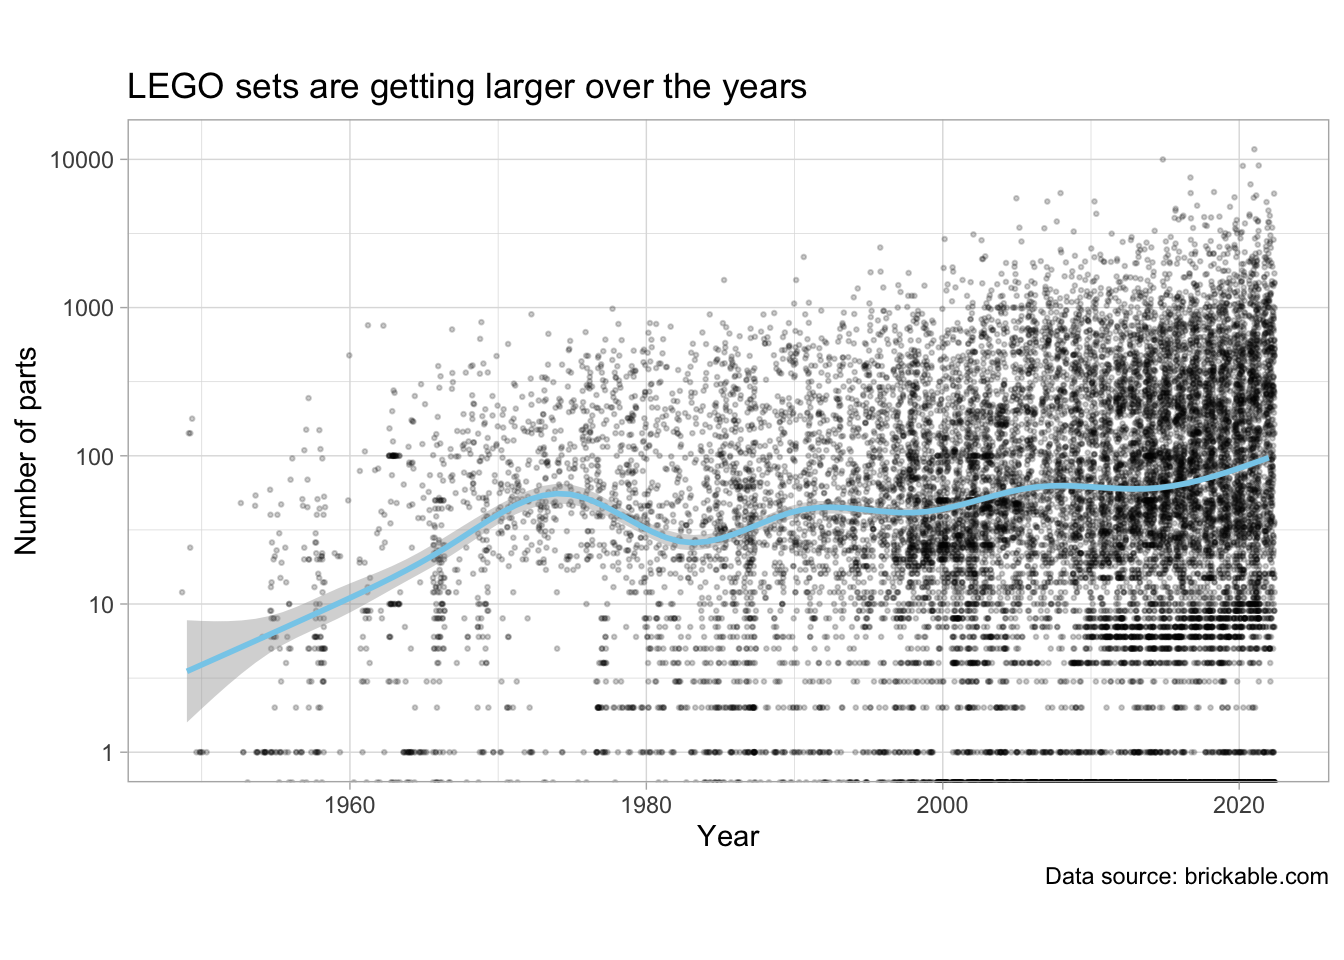
ggplot(sets, aes(year, num_parts)) +
geom_jitter(alpha = 0.2, size = .5) +
geom_smooth(color = "skyblue") +
scale_y_continuous(trans = "log10") +
coord_fixed(ratio = 10) +
labs(x = "Year", y = "Number of parts",
title = "LEGO sets are getting larger over the years",
caption = "Data source: brickable.com") +
theme_light()